
How to populate Asset Performance Charts in real time
With Factech System, we can track and analyse Asset Performance at real time with respective dashboards populating automatically from Log Sheets/ Inputs filled by Facility Team.
DG Efficiency ( SEGR) Chart Example
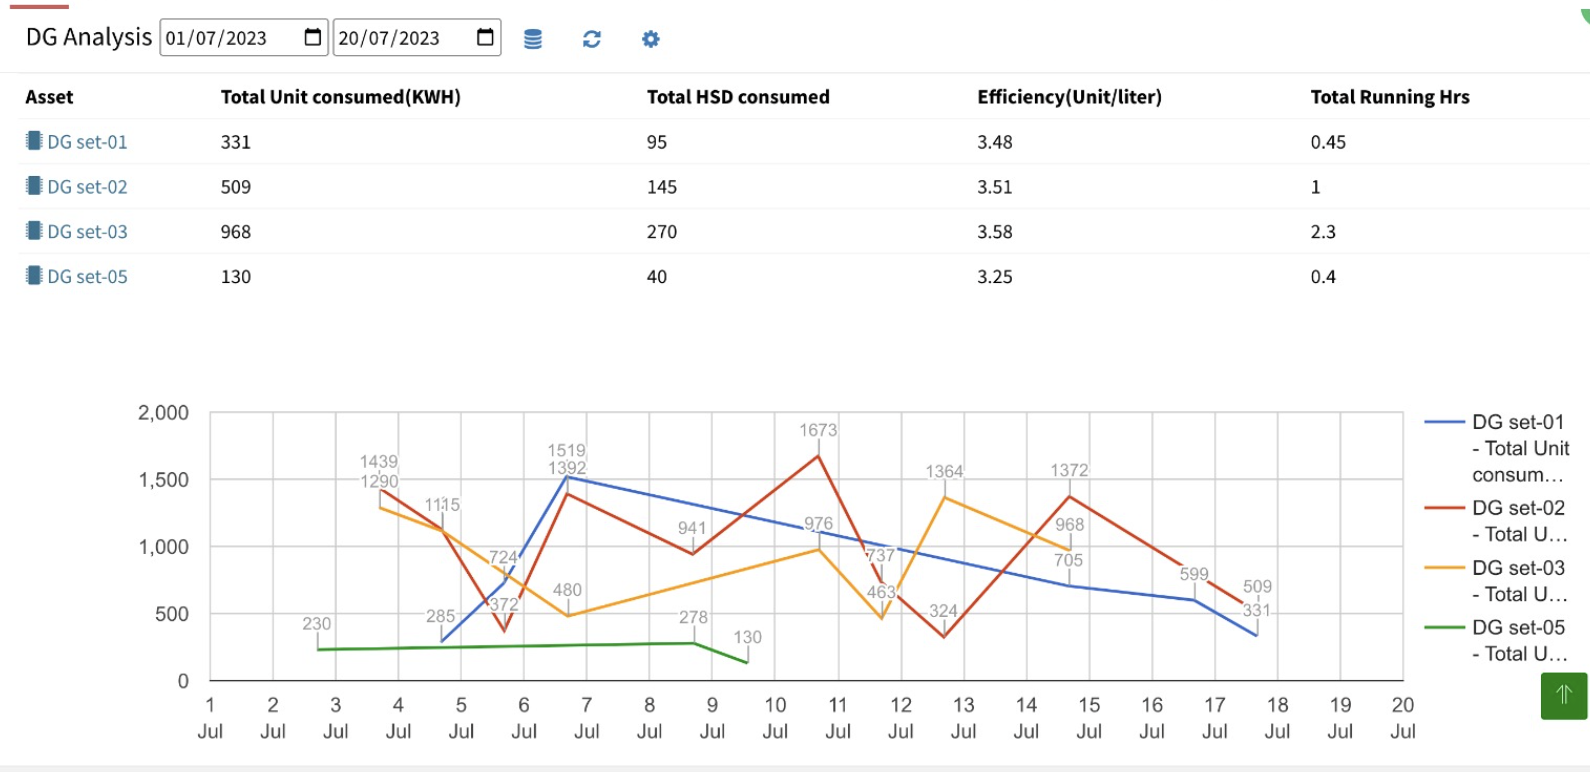
DG Sample Log Sheet
- Running Hrs
- HSD Consumed
- Output Unit
- Unit Per Liter Efficiency(Unit/liter)
Refer https://factech.ai/blog/ufaqs/how-to-use-asset-tracking-field-feature-in-factech-automation/ for steps
Energy Consumption Chart Example
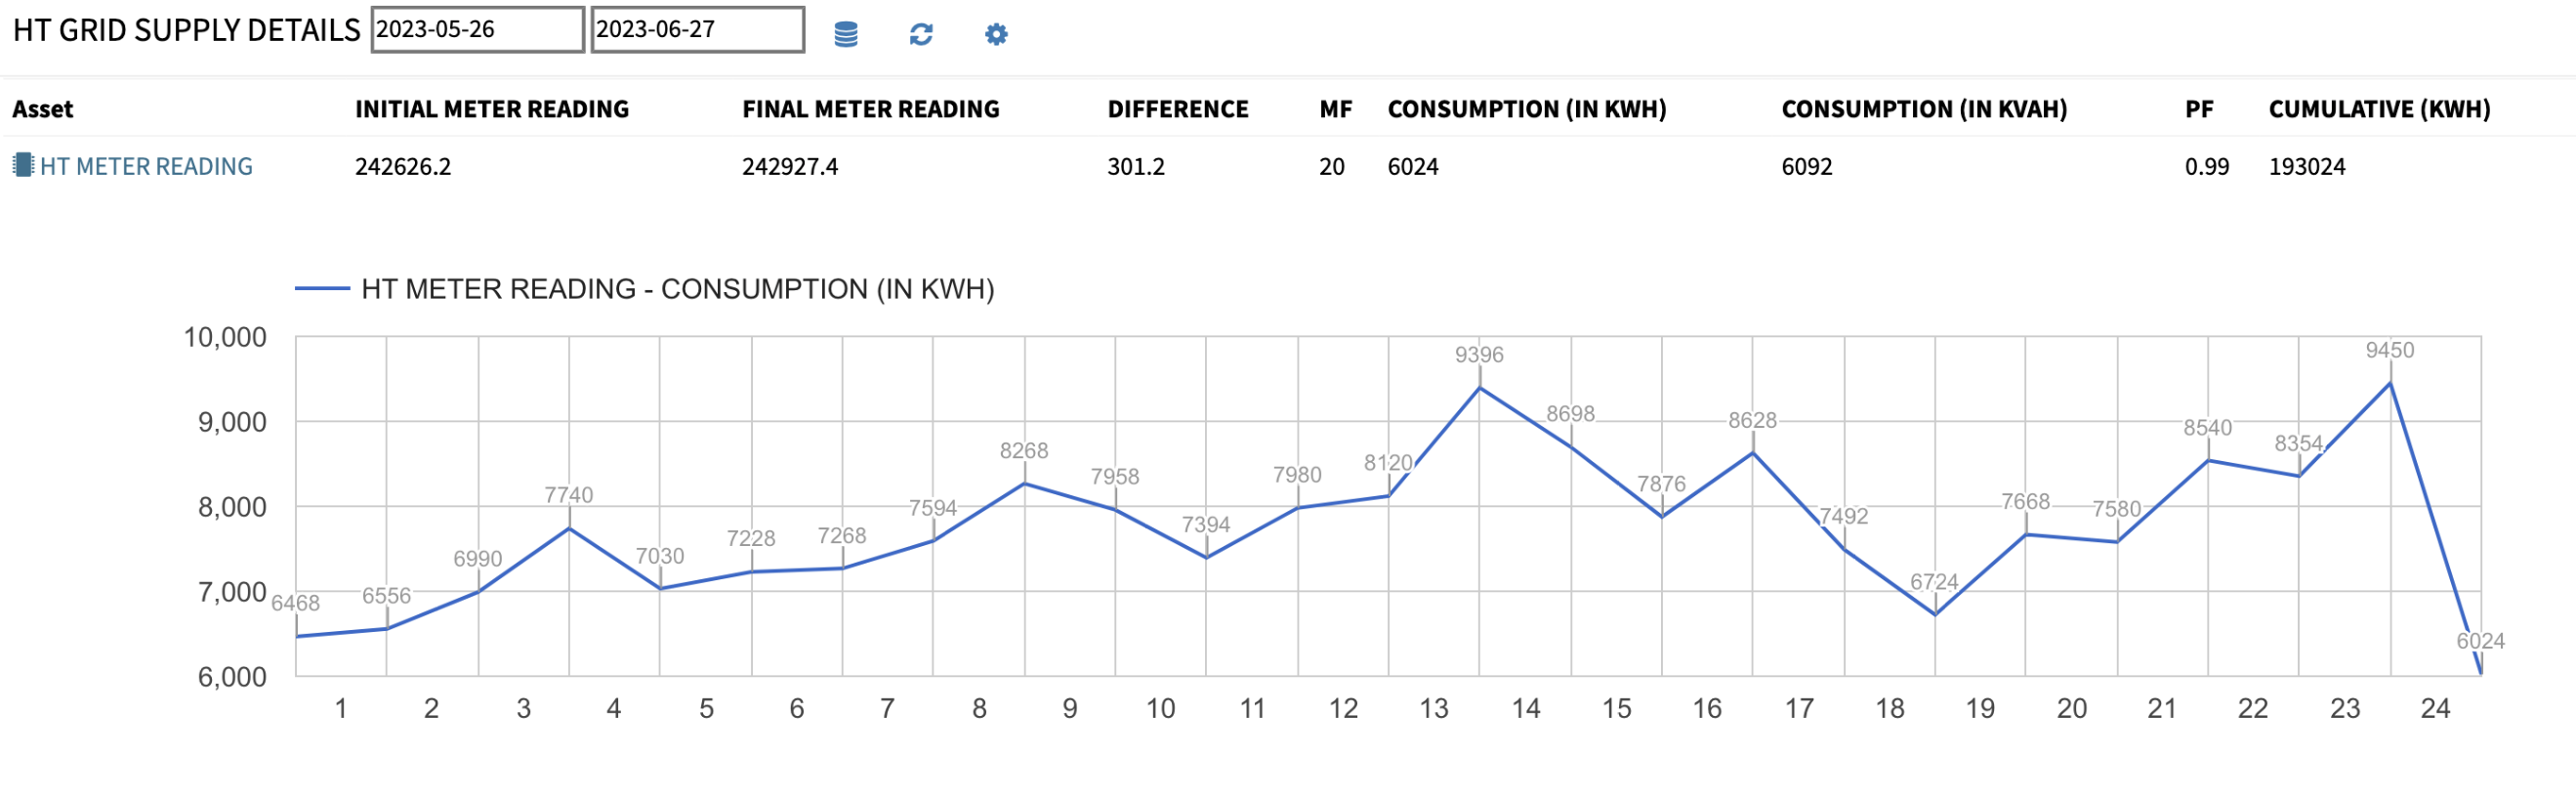
 Sample Electricity Log Sheet
- KVAH Reading
- KWH Reading
STP Water Chart
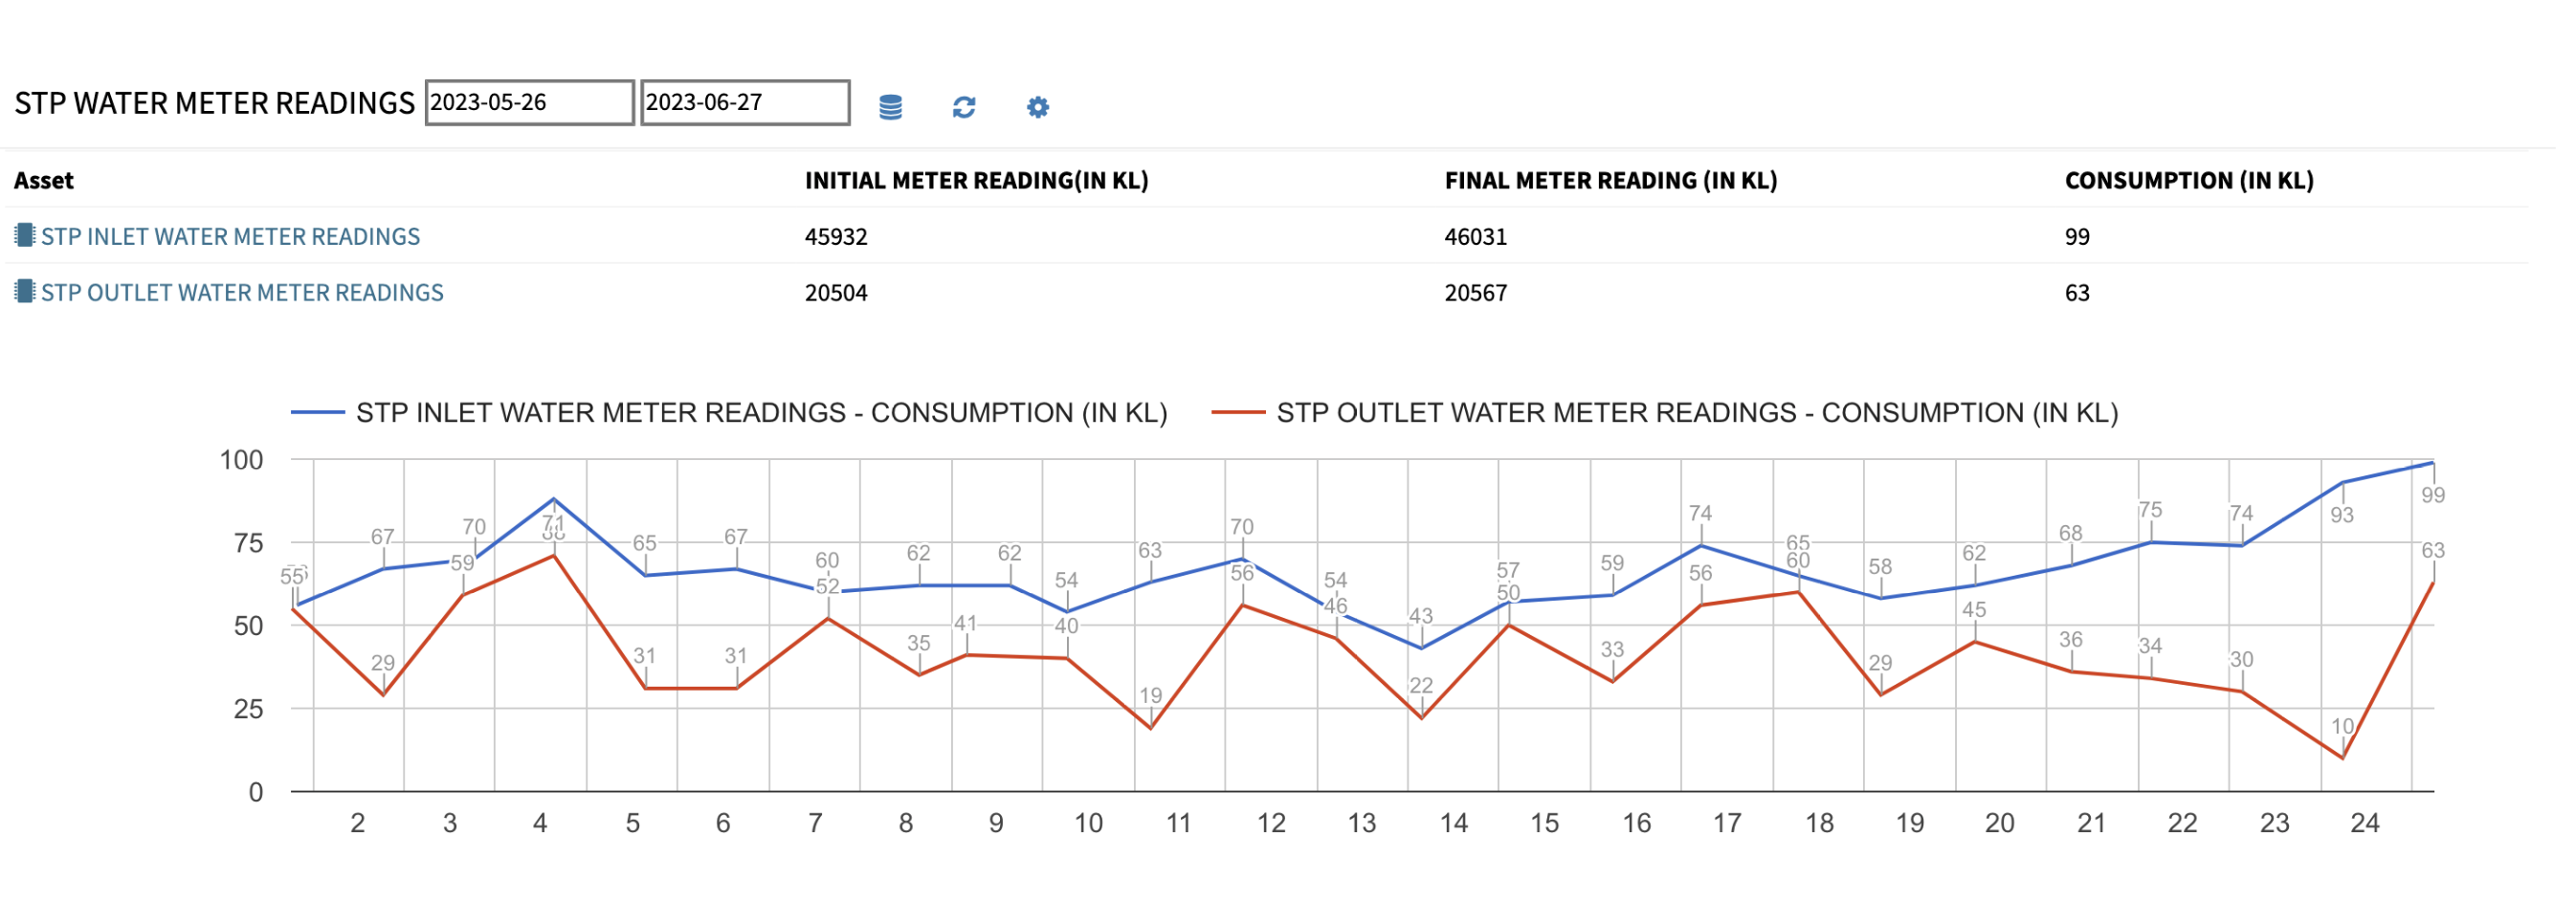
STP Log sheet Fields
- Inflow reading
- Outflow Reading
References
https://factech.ai/blog/ufaqs/how-to-use-asset-tracking-field-feature-in-factech-automation/
How to configure Electricity or Water Reading Logs?


