Complaint Multi Site Enterprises Dashboard
The FacTech platform offers the functionality to configure a Complaint Multi-Site Enterprise Dashboard, enabling organizations to monitor and manage multiple site performances from a single, unified view. This dashboard helps in tracking complaints, analyzing performance metrics, and identifying improvement areas efficiently.

You can configure the Enterprise Dashboard for:
Multiple Sites: View and compare the performance and status of all your connected sites in one dashboard.
Single Site: Focus on one location for a more detailed and enhanced way of tracking complaints and activities.
Let’s understand the components of the Enterprise Dashboard and the steps to configure it.
Step 1: Access the Master Dashboard
- Login to the FacTech portal using your credentials.
- Navigate to the Master Dashboard located in the top-right corner of the screen.

- Click on Edit Dashboard, then select Create New.
- Enter the name of your new dashboard in the ‘Enter Name’ field.
- From the module dropdown, select ‘Enterprise Dashboard’.
Once selected, you can start configuring each component of the Enterprise Dashboard as explained below.
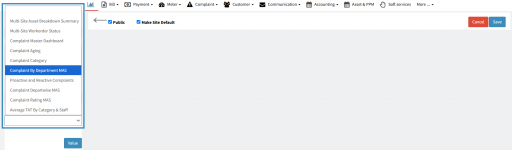
Step 2: Configure the Dashboard Components
After choosing the ‘Enterprise Dashboard’ module, you will see several components available for configuration. Below are the details of each component and their functionalities:
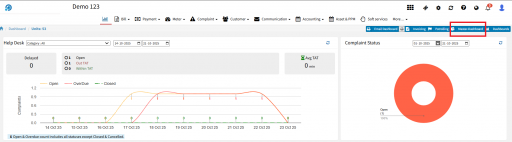
(a) Complaint Multi-Site Dashboard
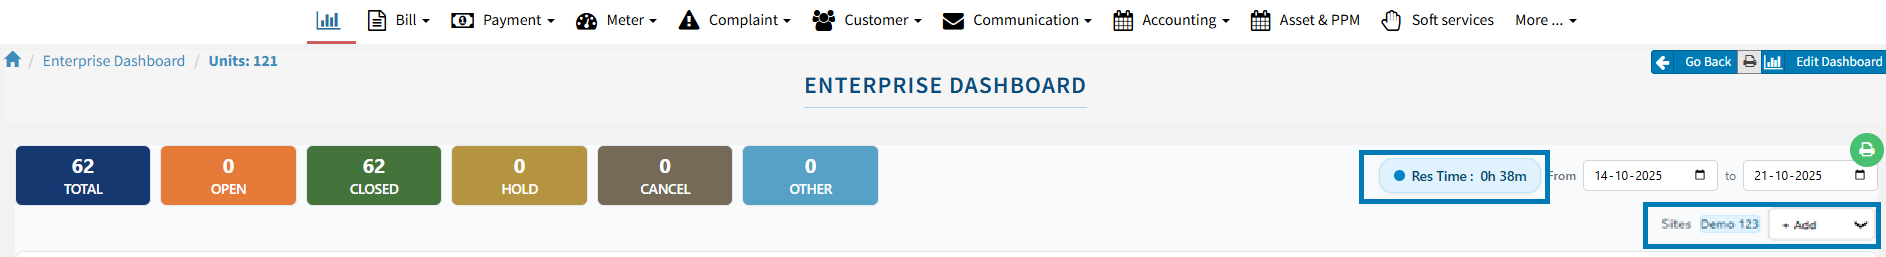
Displays the details of all linked sites, including:
- Complaint counts by status (Open, In Progress, Closed, etc.)
- Average resolution time
- Data filtered by date range
Note: Multi-site linking is configured with the assistance of the FacTech backend team.
After selecting this component, click on ‘Value’ to add it to your dashboard.
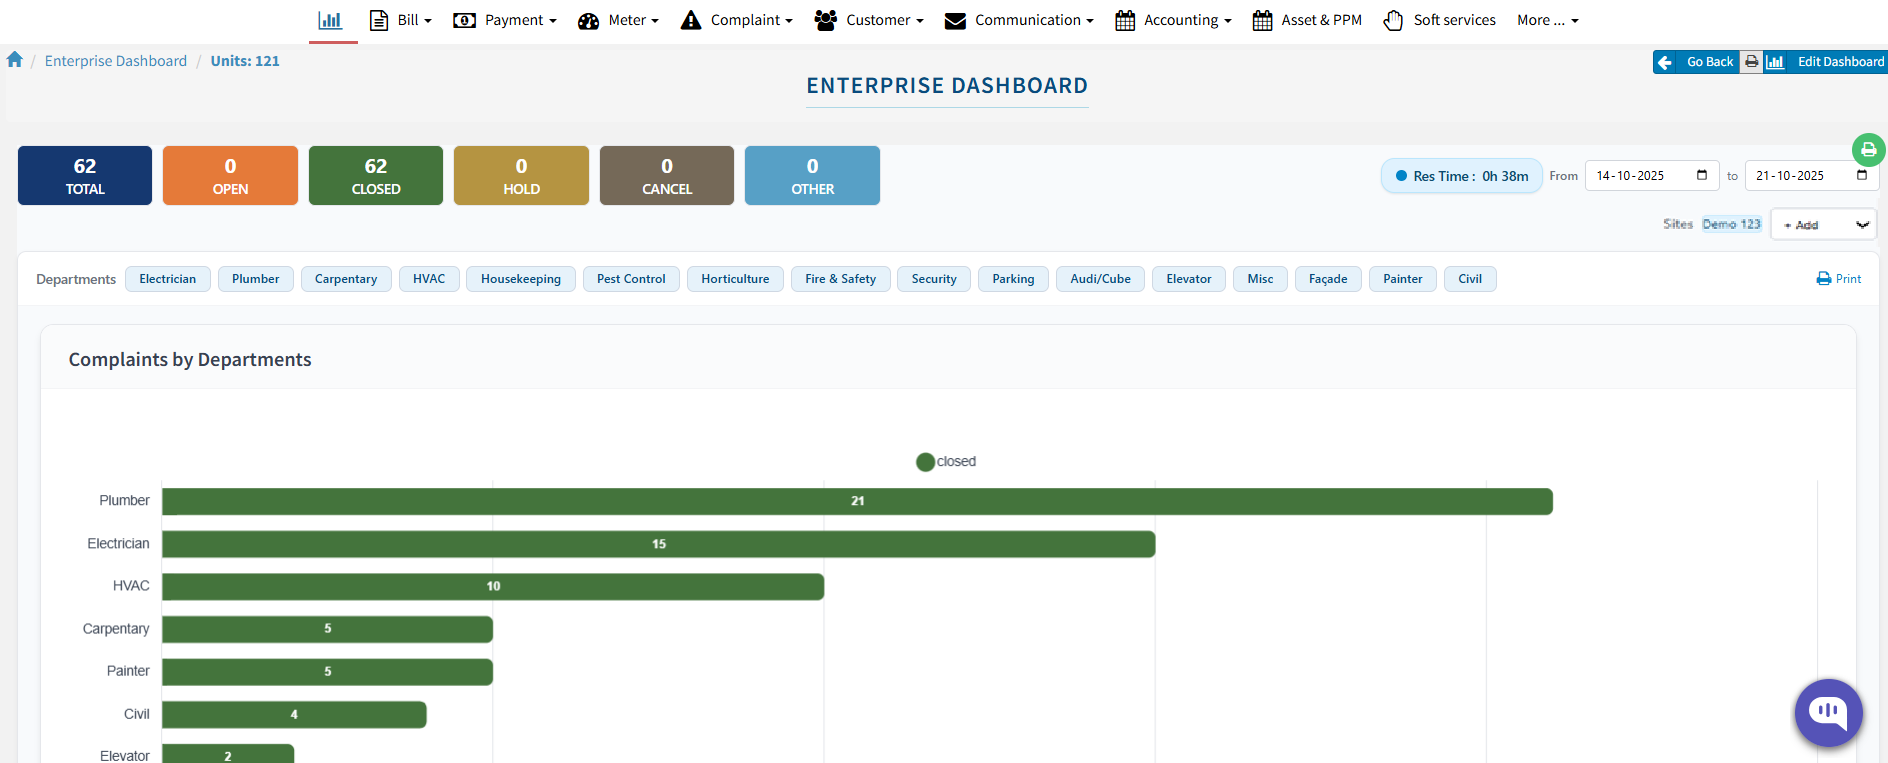
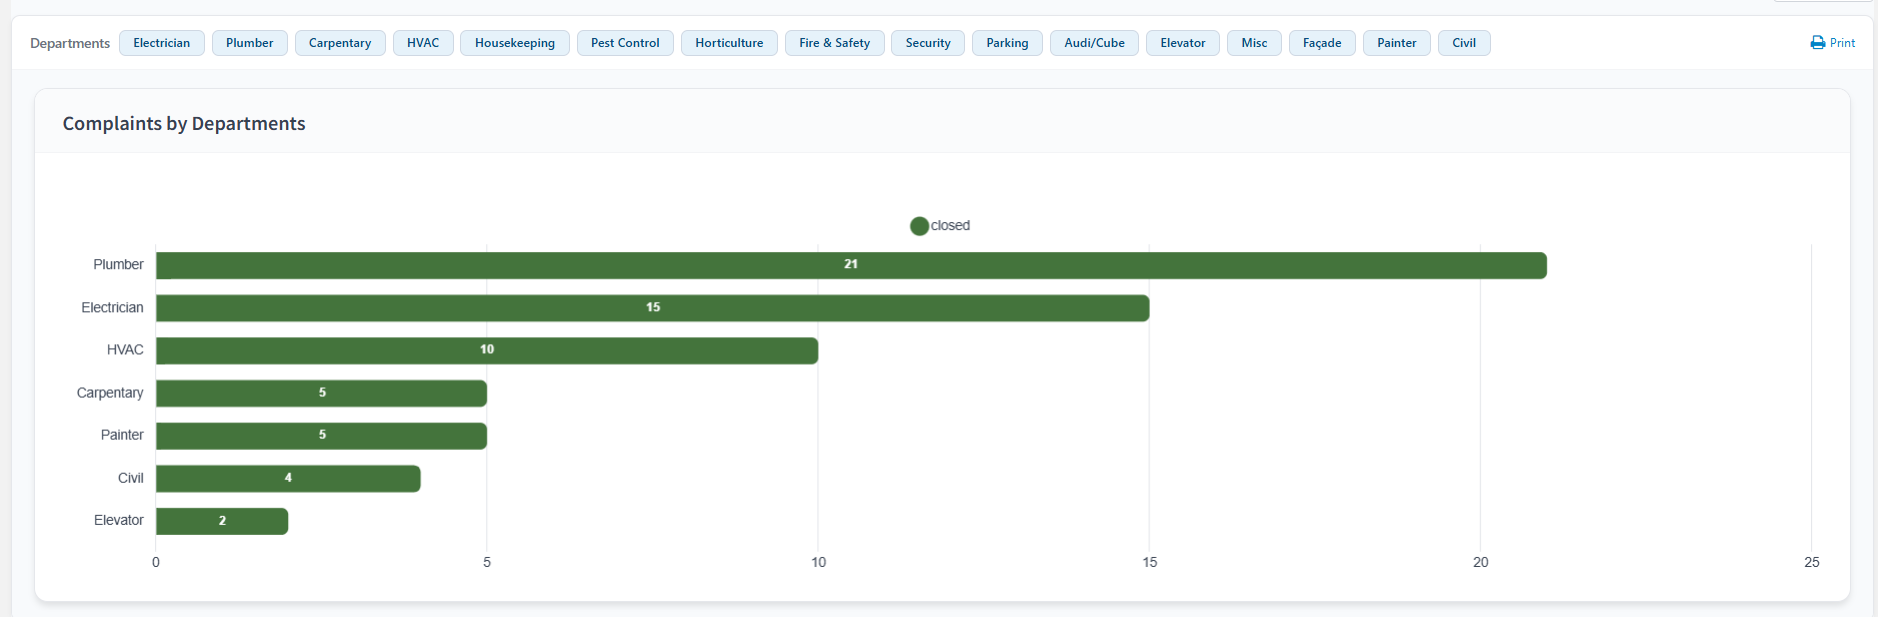
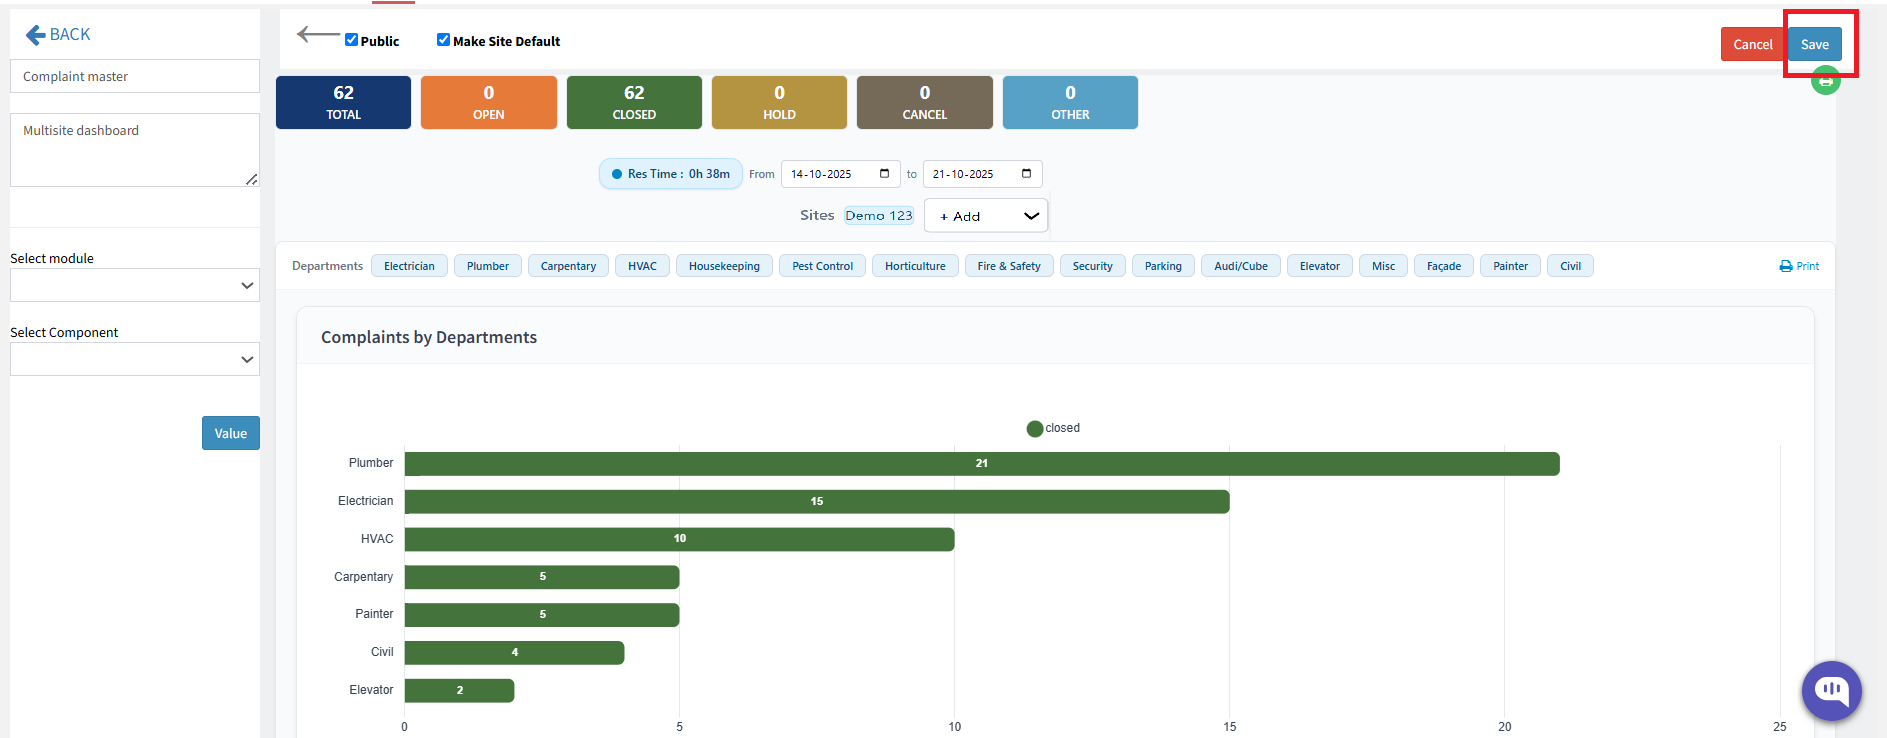
(b) Complaint by Department (MAS)
It shows complaint data categorized by department.
You can apply filters to view specific department-wise information.
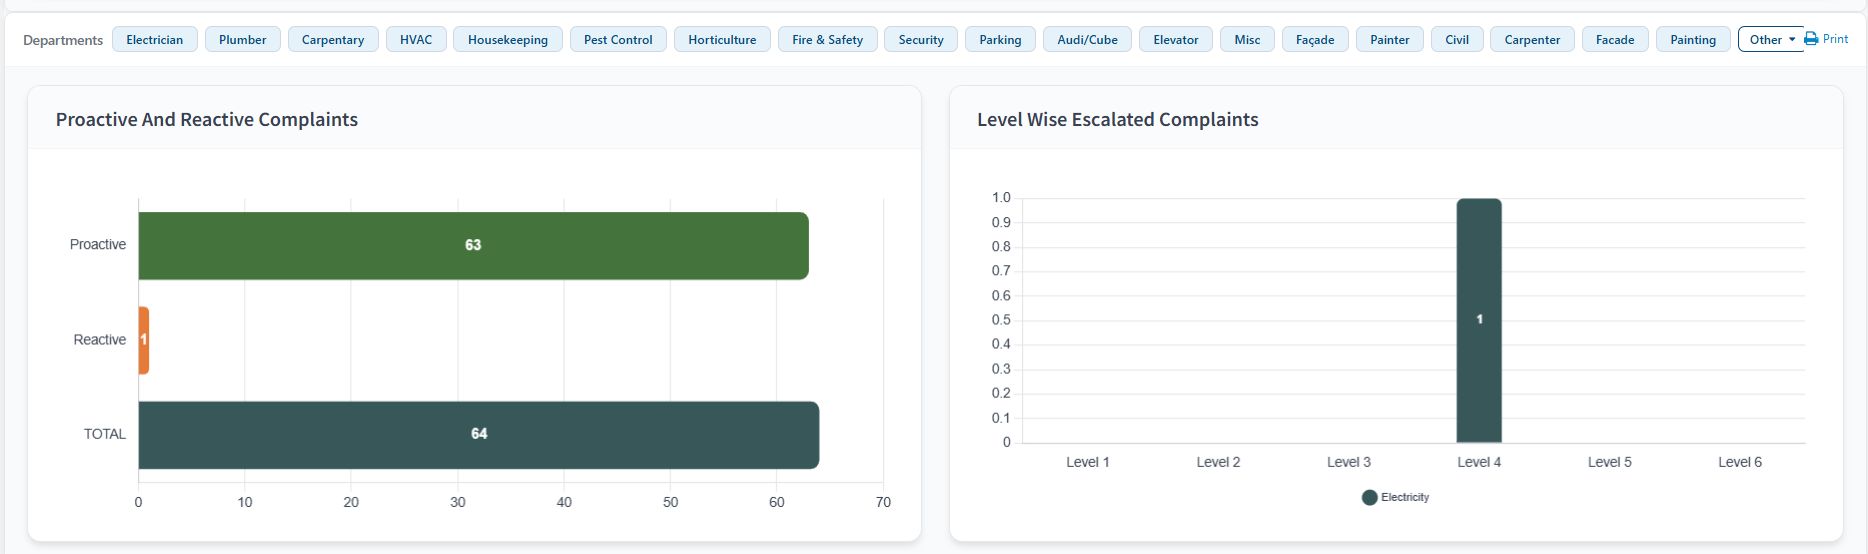
(c) Proactive and Reactive Complaints
Displays counts of proactive and reactive complaints, along with level-wise escalation data.
- Proactive Complaints: Raised by Admin or Staff via the FacTech Admin Portal or staff application Click here to get the app.
- Reactive Complaints: Raised by Tenants or Public Users via the Tenant App (Click here to get the iSociety App) or Public Complaint QR.
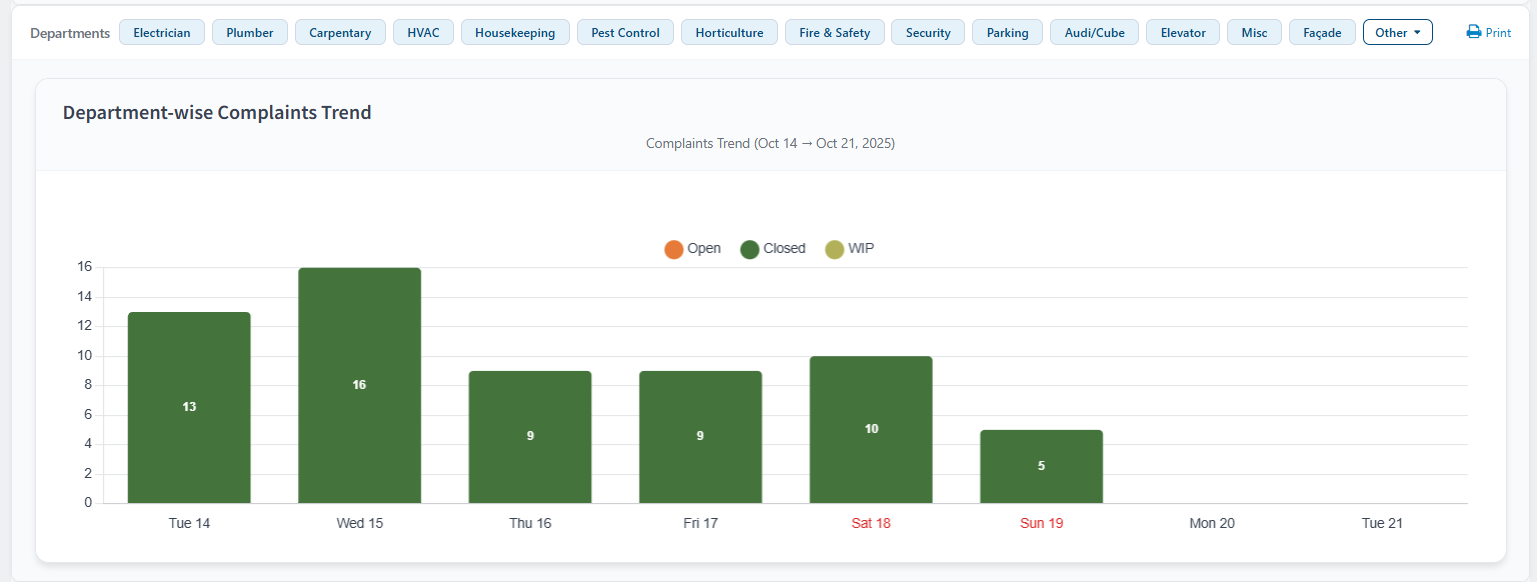
(d) Complaint Depart-wise MAS
Shows day-wise data of a week, distinguishing weekdays and weekends (weekends are highlighted in red).
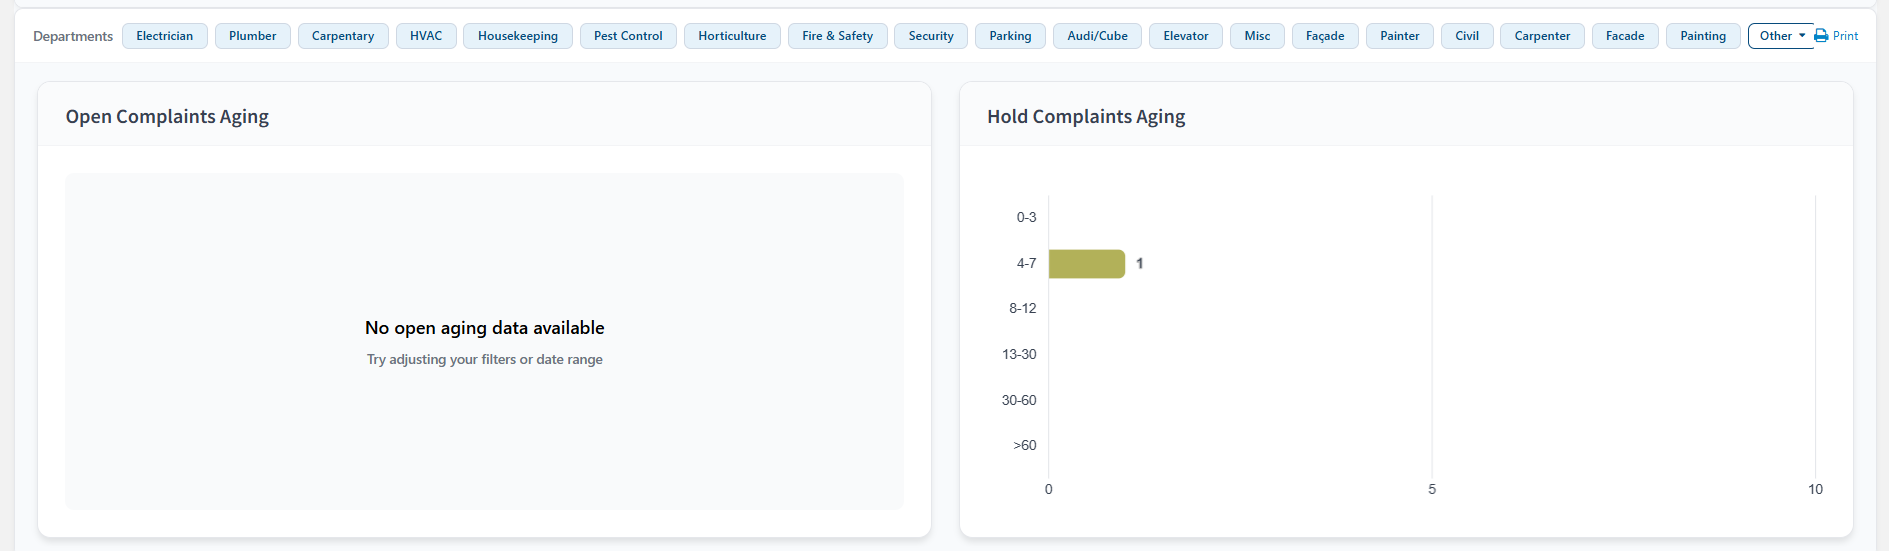
(e) Complaint Aging
Displays the age and count of complaints that are currently Open or On Hold.
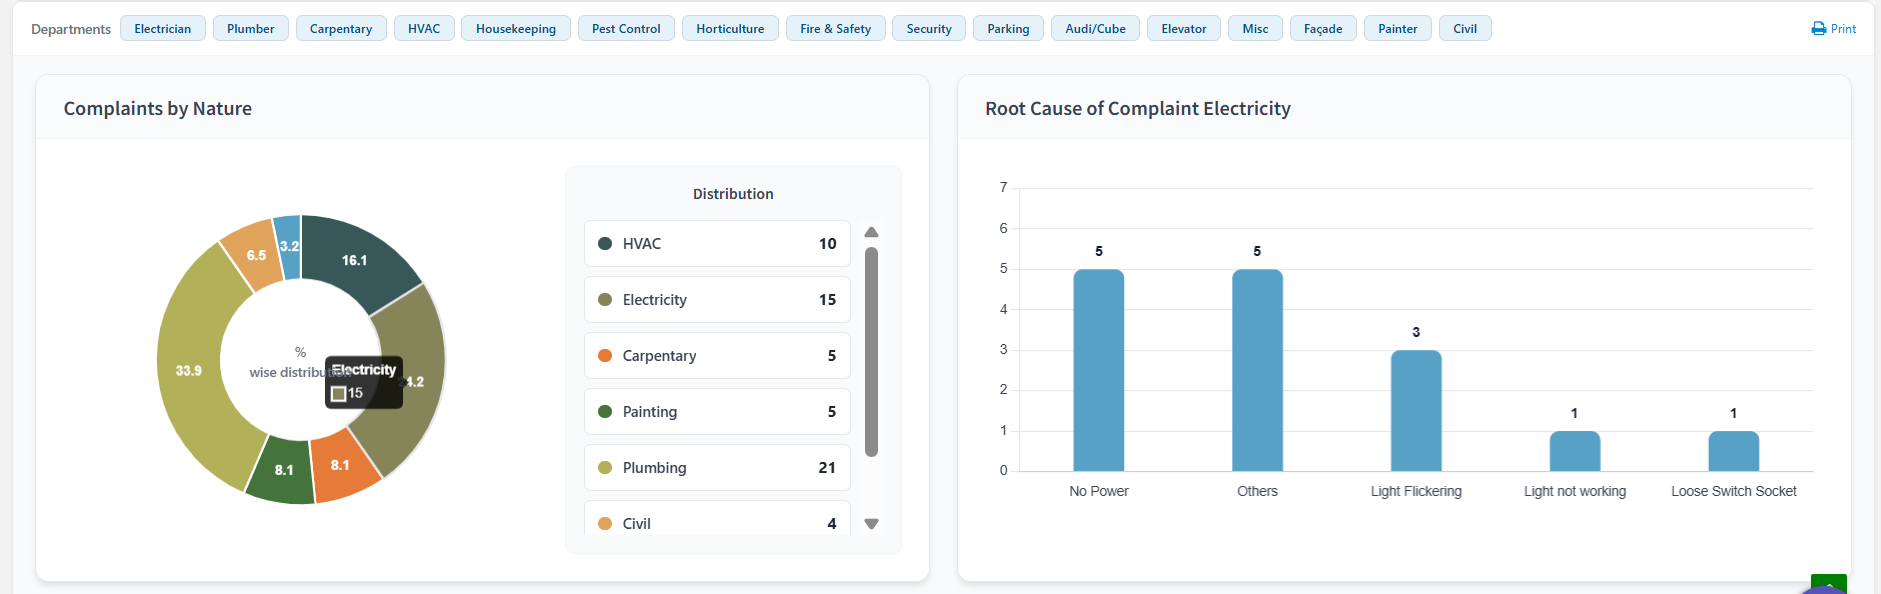
(f) Complaint Category
Shows the nature-wise count and percentage of complaints using a pie chart.
Clicking on any segment displays related root causes or sub-natures (sub-categories) of complaints.
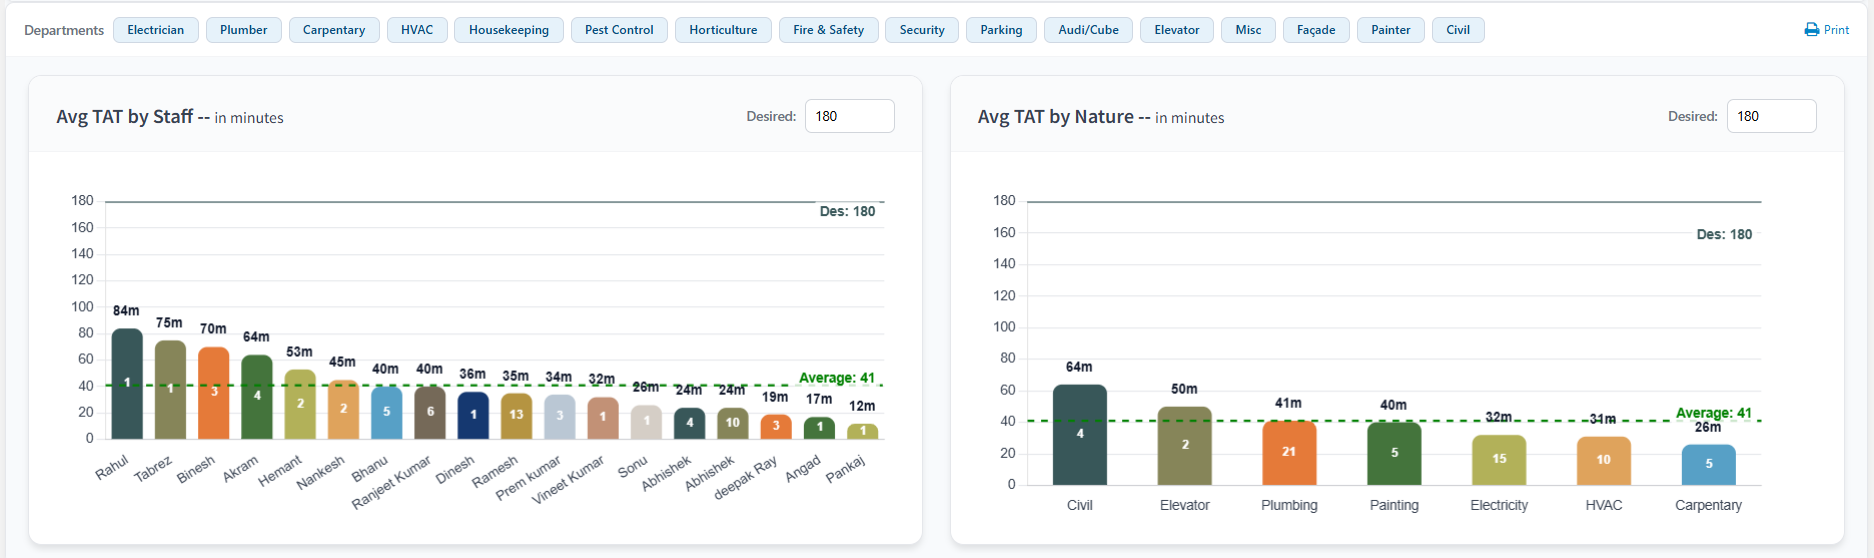
(g) Average TAT by Category & Staff
Shows the Average Turnaround Time (TAT) categorized by nature and staff.
You can also set a desired TAT and compare it with the actual average TAT to evaluate performance.
(h) Complaint Rating MAS
Displays user feedback ratings:
- Ratings 1 to 3 in one section
- Ratings 4 & 5 in another
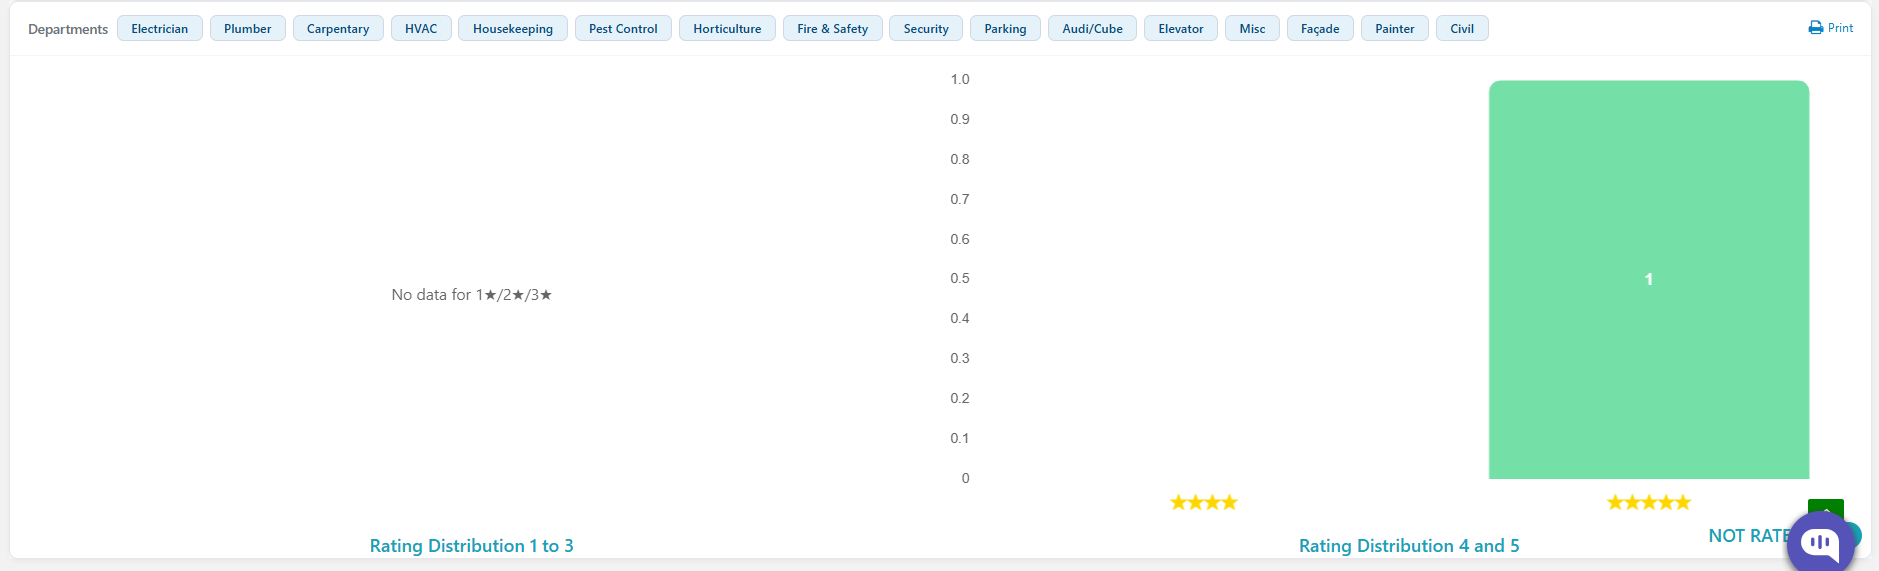
If a user rates a complaint after closure, it automatically reflects in this component.
After selecting each desired component, click on ‘Value’ to add it to your dashboard.
Step 3: Save the Dashboard
Once all relevant components are configured, click on the Save button to finalize your dashboard setup.
Your Enterprise Dashboard is now ready to use!
You can access it anytime by navigating to ‘Master Dashboard’ from your FacTech portal.
Thankyou!!
Ready to Transform Your Facility Management?
See how Factech automates maintenance, assets, and compliance in one intelligent platform.
Let's Talk
Have questions about our AI-powered solutions? Our team is here to help you digitize your facility operations.
- ✉️ sales@factech.ai
- 📞 +91-XXXXXXXXXX
- 🌐 factech.ai


